- Jan 26, 2026
- 4 min read
A Weather Planner for Bikepacking, Built From Free Data
Built in 2023, revisited now: what I made, and what I’d do differently today.
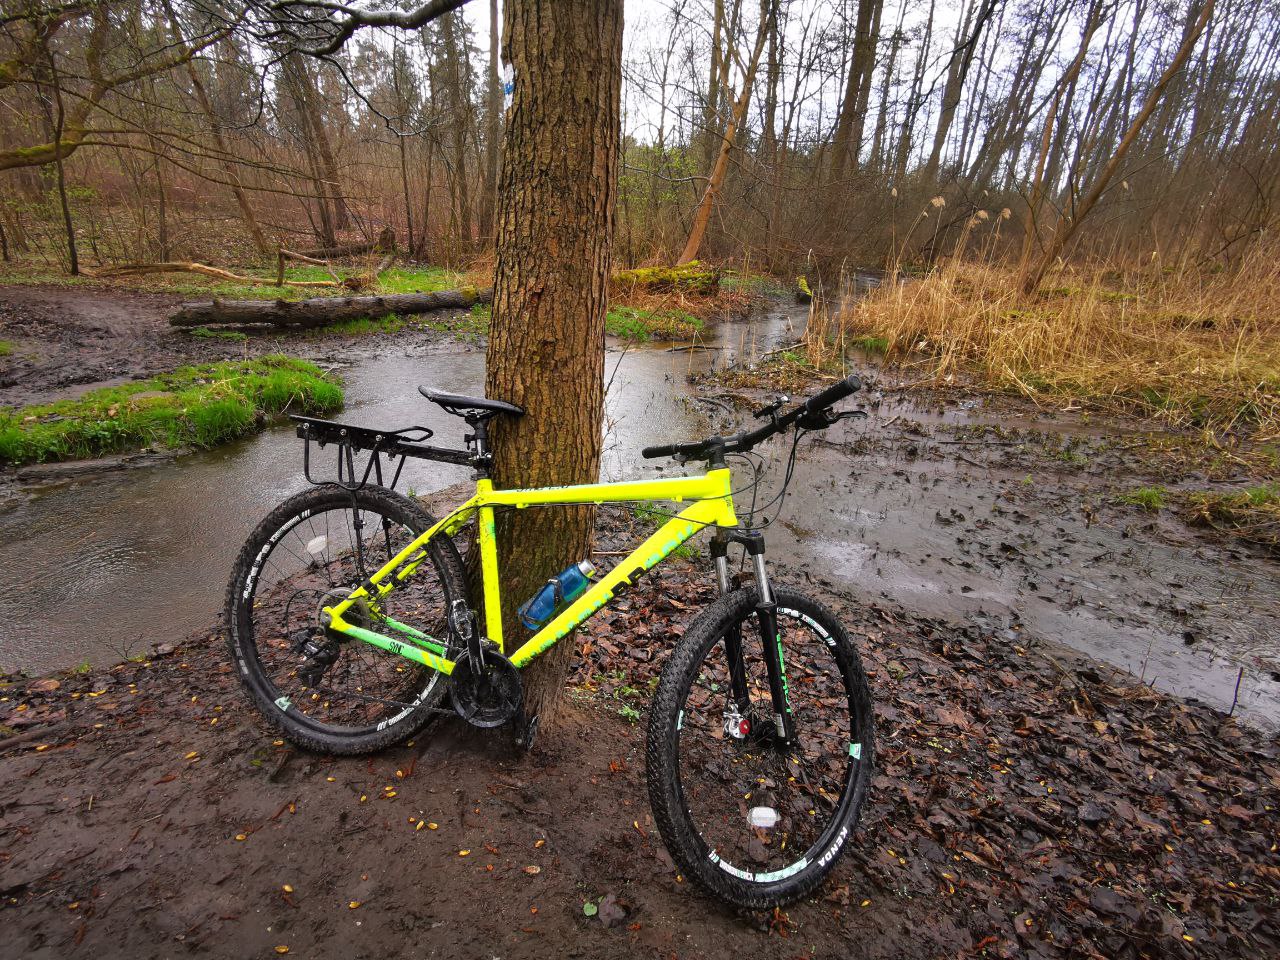
In 2022 I cycled from Poland to Hungary with everything on the bike. Most days the weather was kind. A few times it wasn’t, and I got caught in cold rain and mud with no warning I’d have taken seriously.
Planning the next stages, I kept asking two questions a normal weather app doesn’t answer well:
- What’s the weather usually like there in that month? (for planning months ahead)
- What’s coming this week? (for the next few days)
So in 2023 I built an app that answers both from one map.
What it does
- Click a place on a map and pick a date range.
- A line chart of daily maximum and minimum temperatures there over the years.
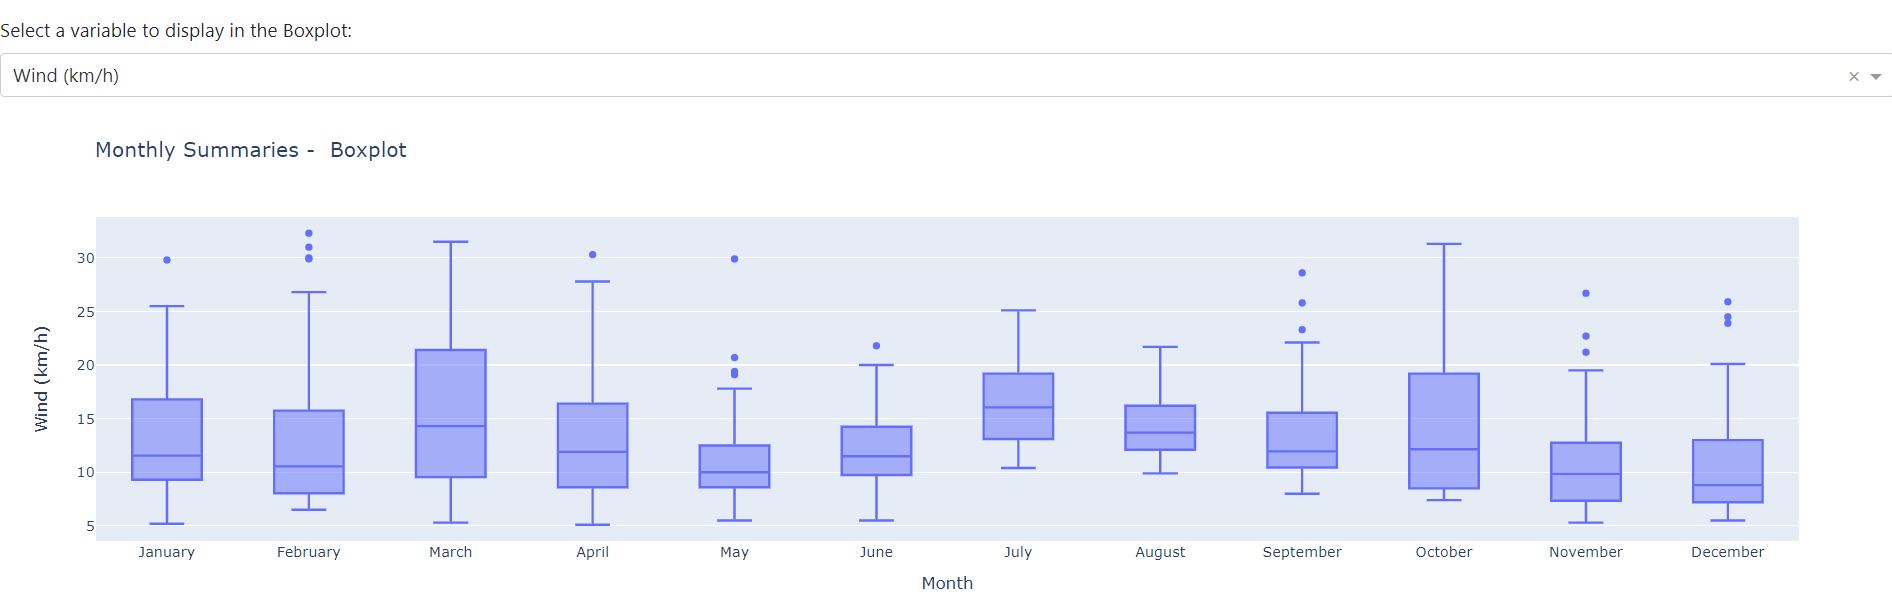
- Box plots per month of temperature, wind and precipitation: not just the average, but the spread. “May is usually 15 to 22 °C, sometimes 8” is more useful than “May averages 18”.
- A forecast for the coming days at the same spot.
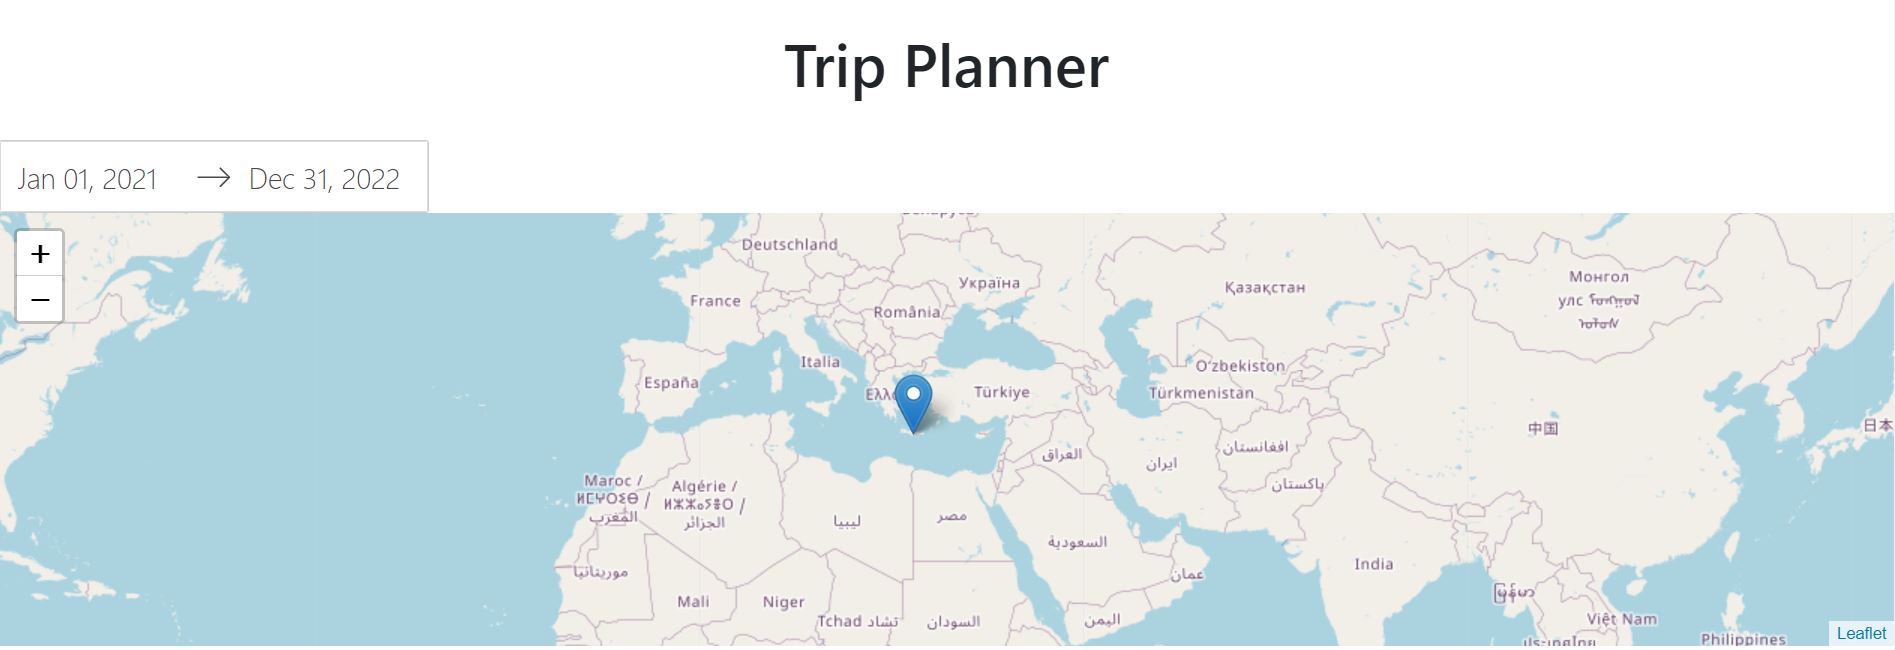
It defaulted to Crete, one of my favourite islands, so the first screen was never empty.
Built from free, open pieces
| Piece | Job |
|---|---|
| Dash (Python) | the web app: inputs, callbacks, layout |
| dash-leaflet | the clickable map |
| Meteostat | historical daily weather from stations and reanalysis data |
| Open-Meteo | the forecast |
| Plotly | the line and box charts |
The forecast wasn’t in the first version. After I published the historical one, people pointed me to Open-Meteo: a free, open-source weather API with no key needed. Adding it made the app genuinely useful for the week ahead, not just for dreaming about next season. The best feature came from a reader.
Things that weren’t obvious
Not every point on the map has history. Meteostat builds history from weather stations. Click in the middle of a sea or a mountain range and there may be nothing nearby. The app had to show “no data here” clearly instead of an empty chart that looks like a bug.
Spread beats averages for planning. The box plots were the reason the app was worth using. An average temperature hides exactly the cold, wet days you want to prepare for.
The defaults made it look like a prototype. A whole iteration went into the UI: layout, chart colours and consistent styling, so the charts read as one app. It sounds cosmetic, but it’s the difference between a demo and a tool.
One image for every machine. I wanted the same Docker image to run on a normal PC and on a Raspberry Pi. That meant learning multi-architecture images: one image name, a manifest that points each CPU type at its own build.
Hosting cost more than building. The first deployment was on Google Cloud Run. It ended with a bill I didn’t expect, and the app moved home behind a Cloudflare tunnel. That’s its own post.
Open source, three ways to try it
GPL-licensed on GitHub, with a container image on GHCR, so it runs with one
docker run. There was also a Colab notebook with the data code, so anyone
could explore the APIs without installing anything.
What I’d do differently now
- One data source. Open-Meteo also has a historical weather API. Using it for both history and forecast would remove a dependency and the “no station nearby” gaps.
- No server. Open-Meteo can be called straight from the browser. The whole app could be a static page with a map and charts in JavaScript: free to host, instant on a phone, nothing to keep running at home.
- Plan routes, not points. A trip is a line of stages. Weather along a route for given dates would answer the real question: where will I be when the rain comes?
- Cache what doesn’t change. Last decade’s weather won’t change. Fetch it once per place, not on every click.
Takeaways
- Build the tool you needed on the road. It’s the easiest one to judge.
- Show the spread, not the average, when people plan around bad days.
- Publish early. The best feature came from someone who used the first version.
- Count the hosting, not just the code. It cost more than everything else.