- Jan 8, 2026
- 4 min read
What 5% Inflation Does to a Lifetime of Savings
A model I built at the end of 2021, revisited: what it showed, and how I’d build it today.
Retirement is one of those topics where a conversation turns into an argument in about two minutes. Everyone has a strong opinion and nobody has a number.
At the end of 2021 I built a small interactive app with one goal: put the maths on the table and leave the opinions off it. It runs one deliberately simple scenario and shows what inflation does to it.
The model: six inputs
| Input | Meaning |
|---|---|
| Inflation rate | yearly, constant |
| Yearly savings | how much you put aside each year (any currency) |
| Retirement spending | how much you expect to spend per year once retired |
| Starting age | when you start working and saving |
| Savings plateau | the age when your savings stop growing each year (income and costs rise at the same pace) |
| Retirement age | when you stop working and start spending |
One assumption does most of the work: the savings earn nothing. They sit in cash. The model is really asking “what if I trust my currency to store value?” and nothing else. No investments, no pension, no returns.
The maths
Each year, money you already have loses value at the inflation rate. In real terms (today’s purchasing power):
while working:   balance = balance × (1 − inflation) + yearly_savings
once retired:    balance = balance × (1 − inflation) − retirement_spending
With zero inflation the first line is just addition: save the same amount every year and you can spend all of it later. With inflation, every unit saved in your first working year loses a slice of its value every single year after that, all the way through retirement.
The result
Same person, same savings, same spending. Only inflation changes:
| No inflation | 5% a year | |
|---|---|---|
| Savings at their peak | ~500k | ~200k |
| Money lasts until age | ~97 | ~75 |

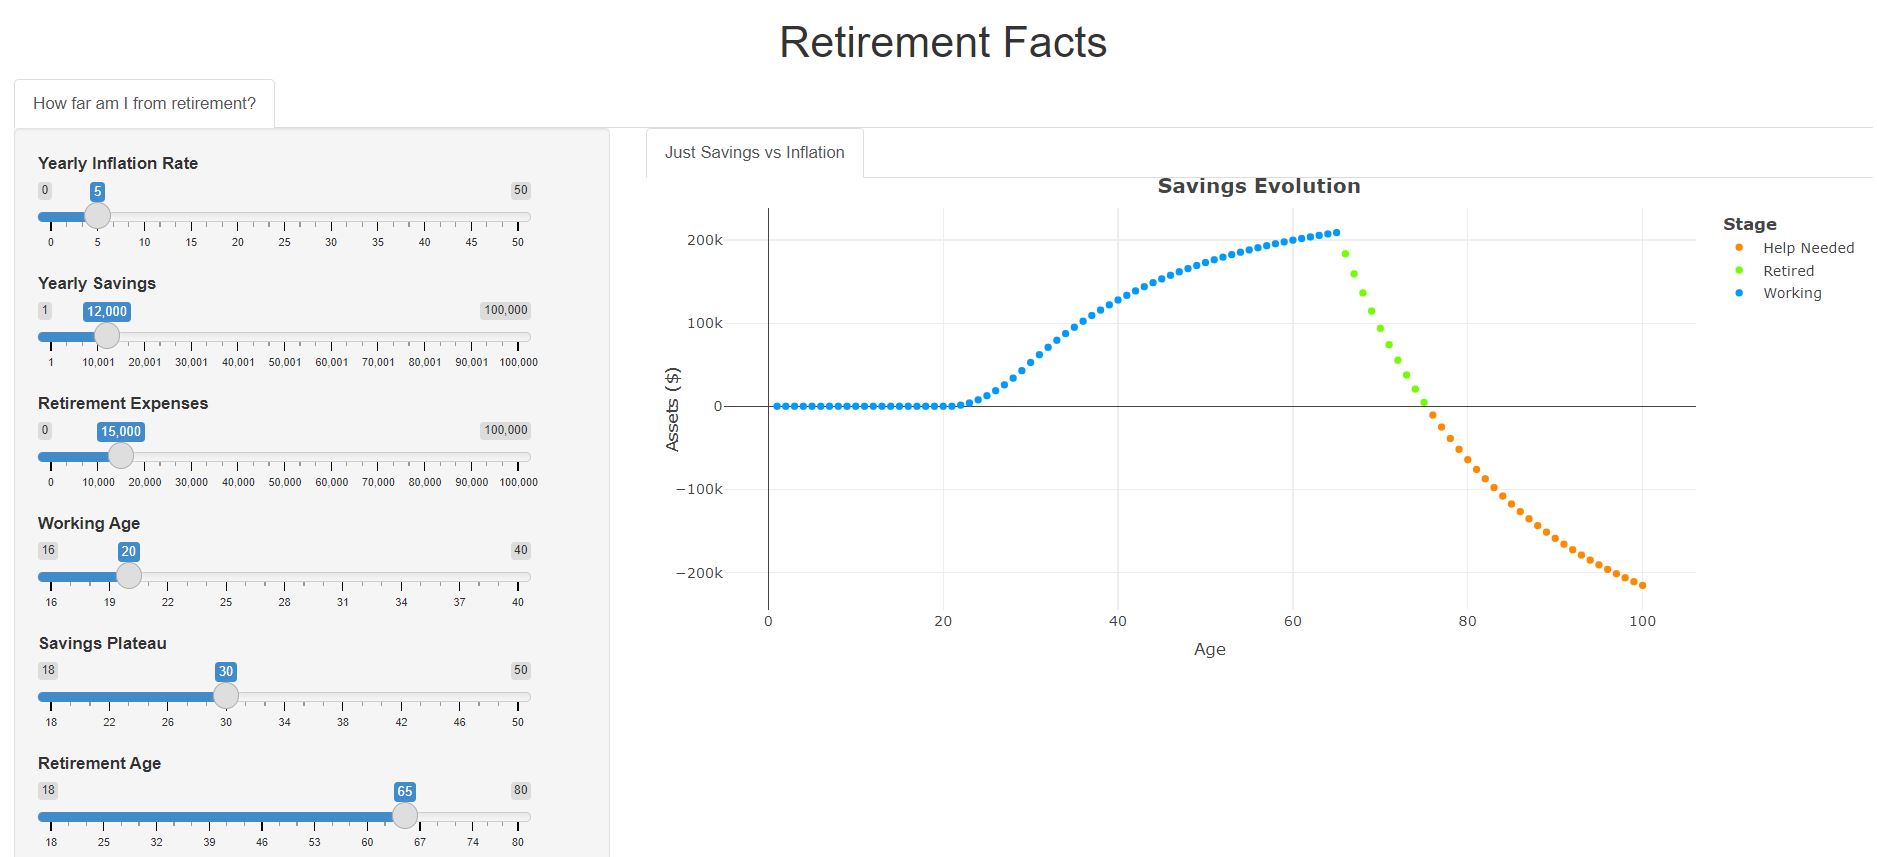
The 5% case doesn’t just peak lower. It also drains faster once spending starts, because prices keep rising while the balance falls. The chart shows years of “help needed” at the end: years where someone else has to pay, even though the same savings would have lasted past 97 with stable prices.
5% isn’t an extreme number either. It’s in the range of what many people have lived through recently.
What the model leaves out (on purpose)
- Investment returns. Adding them is the obvious next step, and it changes the answer completely. That’s the point: the model shows the cost of doing nothing.
- Rising income. Savings grow until the plateau age, then stay flat.
- Pensions, taxes, inheritance, emergencies.
- Variable inflation. It’s one constant rate for the whole life.
A simple model you can see through beats a complicated one nobody trusts. Every assumption is a slider.
Why build a calculator at all
The app did something an explanation couldn’t: people moved the inflation slider themselves and watched their own “help needed” years appear. Nobody had to be convinced. The chart did it.
That’s the reason I still build small calculators. A good calculator turns a debate into “let’s try your numbers”.
How I built it in 2021
- R Shiny for the inputs (sliders and checkboxes) and the server logic.
- Plotly for the interactive chart:
plotlyOutput()in the UI,renderPlotly()on the server. - Deployed on shinyapps.io’s free tier. The code is on GitHub.
What I’d do differently now
I’d build it as one static HTML file with the maths in plain JavaScript: no server, no free-tier sleep, instant on a phone, and easy to embed in a post.
Not financial advice. It’s a model of one assumption, not a plan.
Takeaways
- Inflation compounds against you the same way returns compound for you.
- A model with six visible inputs is more persuasive than a page of argument.
- Say what the model ignores, so nobody mistakes it for a plan.
- Ship calculators as static pages when the maths fits in the browser.