- Mar 3, 2026
- 4 min read
R Stocks, Three Years Later: Rebuilding It in Python With a Friend
Built in 2025, revisited now: what I made, and what I’d do differently today.
In 2022 I built R Stocks, a stock dashboard in R Shiny. In 2025 I rebuilt the idea in Python and called it PyStonks. Same goal: one place for price history, dividends and a few ratios, from free data. Different approach, and this time with a friend on the project.
What changed from 2022
| R Stocks (2022) | PyStonks (2025) | |
|---|---|---|
| Data | four R packages | yfinance, explored in a notebook first |
| Storage | fetched on every load | SQLite, loaded once and reused |
| App | one Shiny app | Streamlit for the proof of concept, then FastAPI + charts |
| Users | anyone with the link | login (PocketBase, then Firebase) |
| Team | me | me and a friend |
Notebook first, app second
The first commit wasn’t an app. It was a Jupyter notebook exploring yfinance: what it returns for a ticker, which fields exist for non-US companies, where the gaps are. I was tired of asking an AI assistant the same questions about the library every few weeks. A notebook answers them once and stays as documentation.
Then the data went into SQLite, inspected with a database browser. Every screen after that read from the local database instead of hitting the data source on each click, which was the biggest weakness of the 2022 version.
The data model before any screen
When my friend joined, the first conversation wasn’t about frameworks. It was: what questions does this app answer? We wrote the list in priority order:
- Historical prices, including companies listed outside the US (Nestlé, Unilever, Munich Re), which many free tools skip.
- Historical dividends, and what happens with each policy: take the cash, reinvest it, or reinvest and keep adding.
- Nice to have: volatility and maximum drawdown, historical EPS, P/E and payout ratio, margins, currency rates, inflation, bringing your own portfolio.
The conclusion we wrote at the end of v2 is the most useful line in the project: get a proper data model first, then build on top of it. Every feature we argued about became easy once we agreed which tables existed.
One chart from that work says more about dividend investing than any ratio:
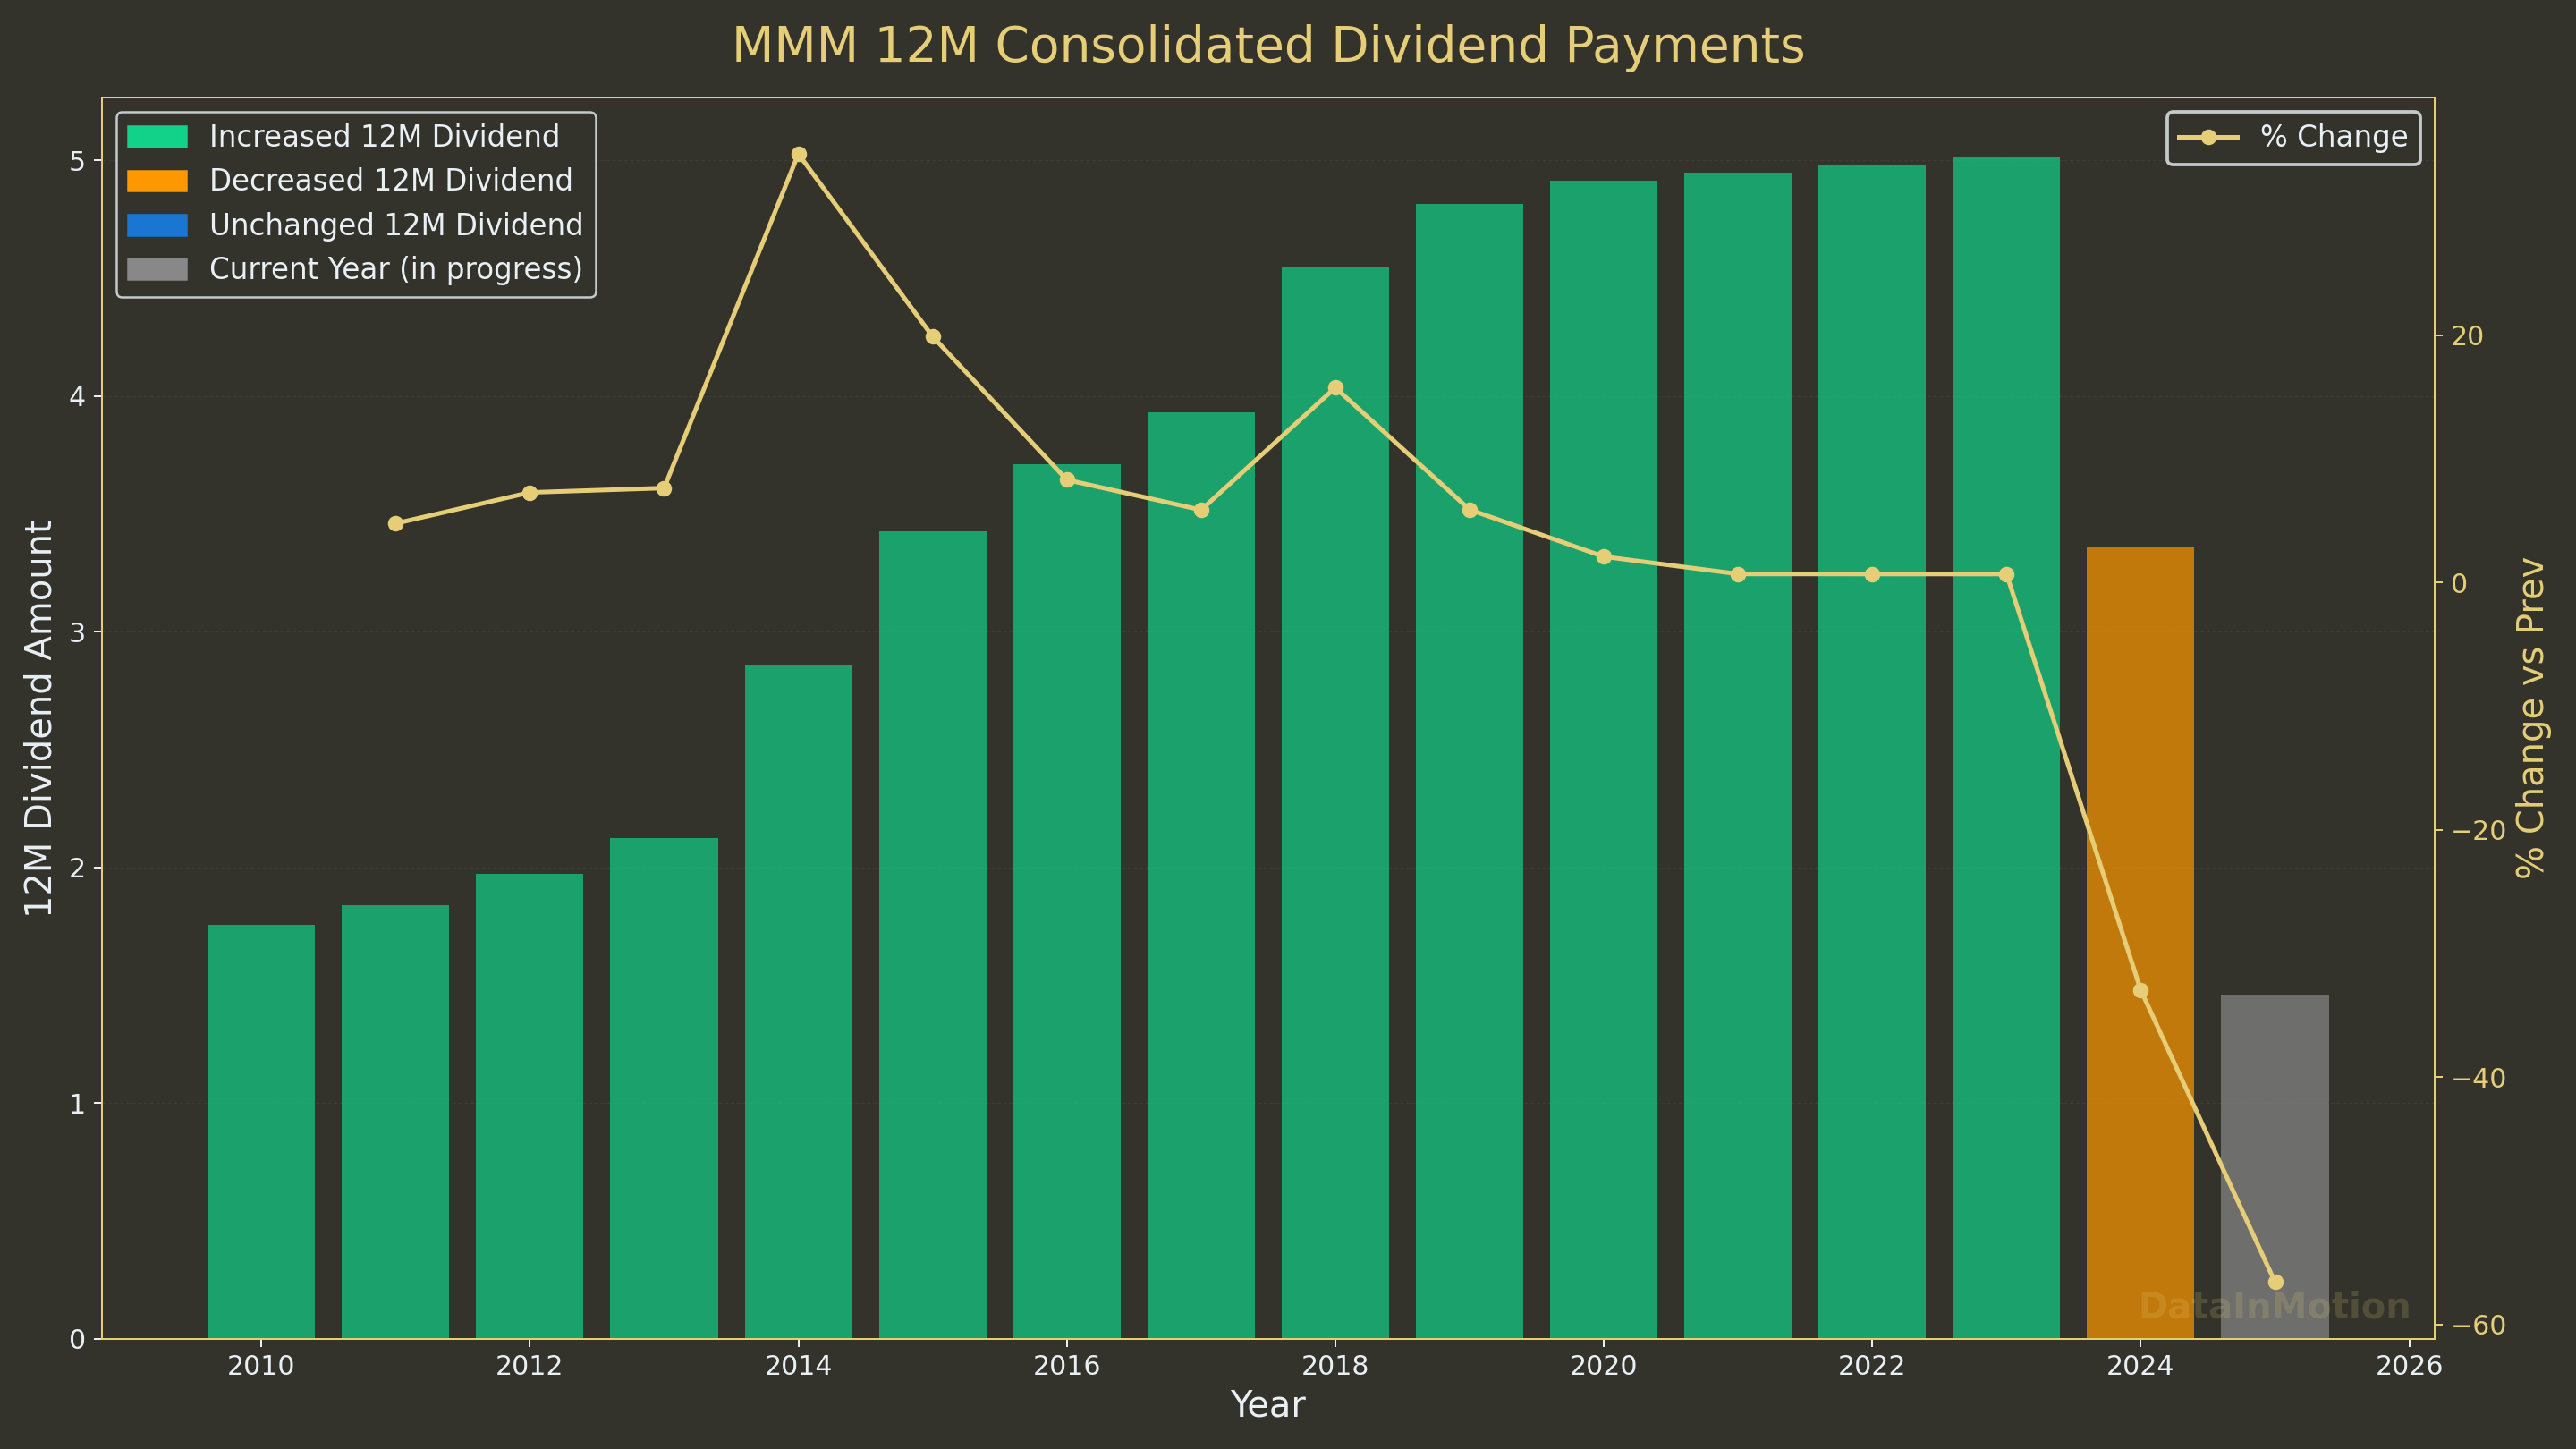
Lists of “companies that always raise their dividend” only contain the ones that haven’t stopped yet. That’s survivorship bias, and a dashboard that shows the full history makes it visible.
Login, the part that took longest
Adding accounts taught me more than the charts did:
- Streamlit + PocketBase: sign-up and login against a PocketBase users collection. Quick, and identity lives next to the app’s data.
- FastAPI + Firebase Auth: worked on desktops and, at first, not really on phones. Getting Firebase login working on mobile came down to configuration (authorized domains, redirects), not code.
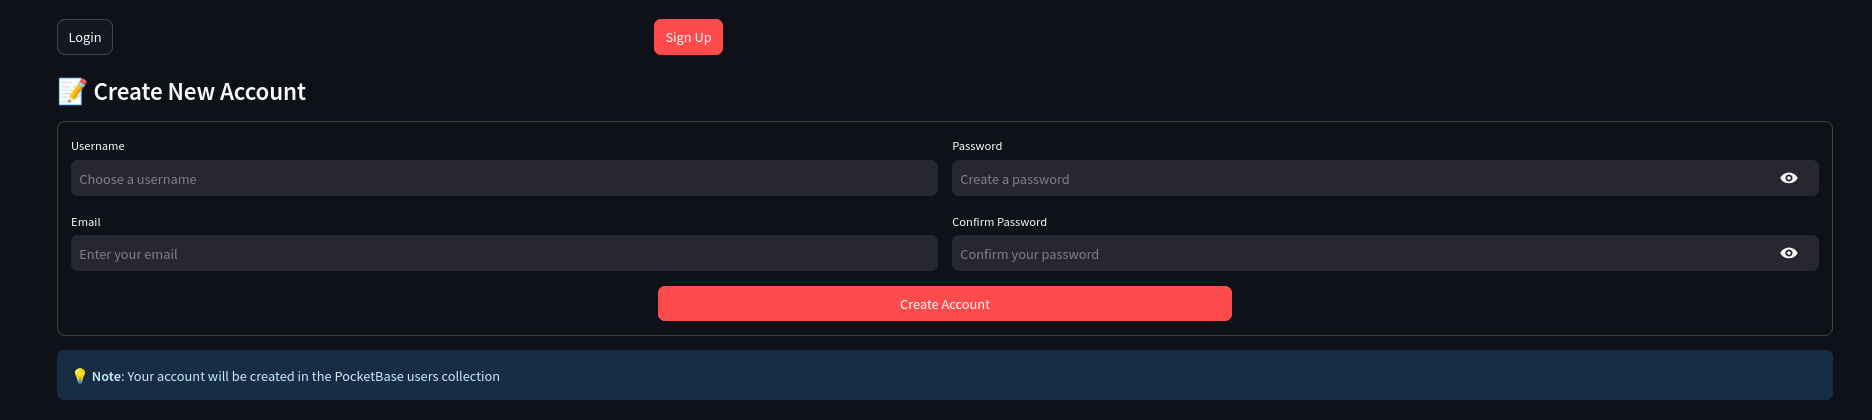
Auth turned out to be the same decision on every small product I built that year, and the one I’d think about first next time.
How not to marry a framework
Streamlit was perfect for the proof of concept: charts and inputs in an afternoon. It was the wrong place to stay. The FastAPI version turned out more flexible: the same endpoints feed any front end, including a static Astro site, which Streamlit and Flask don’t fit into as easily.
The rule I took from it: use the quick framework to find out what to build, then move the logic behind an API before the quick framework becomes the product.
The maths on users
While building it, I looked at people doing similar projects in public. One example: an account with about 7,000 followers converted to 17 paying users, roughly 0.2%. Free calculators everywhere compete for the same attention.
That’s not a reason to stop. It’s a reason to build for the people who’ll use it (in our case, ourselves first) and to treat any paying user as a bonus, not a plan.
What I’d do differently now
- Agree the questions and the data model on day one, in writing, before either of us wrote code.
- Start with FastAPI behind a static front end, and use Streamlit only for internal exploration.
- Load data on a schedule, not on demand, and keep the history in the database.
- Check whether an existing tool covers it. Self-hosted portfolio trackers like Ghostfolio do a lot of this. The gap we cared about (long dividend and ratio history for non-US companies) was narrower than “a stock app”.
Not financial advice: it’s a tool for looking at public data.
Takeaways
- Notebook first: explore the data source before designing screens.
- Data model before features, especially with two people.
- Quick frameworks for discovery, an API for the product.
- Expect ~0.2% conversion, and build something worth using anyway.