- Apr 21, 2026
- 3 min read
A Track-Day HUD From Action-Camera Telemetry
Tinkered in 2025, revisited now: what I made, and what I’d do differently today.
Karting and track days are expensive, so you want to learn something from every lap. The people who improve fastest record their laps and compare them. There are good paid tools for that (RaceChrono, Garmin’s software, dedicated telemetry extractors) that put speed, a map and lap times over your video.
My action camera already records GPS while it films. So the question was: how far can I get with free tools and a bit of Python?
Step 1: get the telemetry out of the video
The camera stores GPS samples inside the MP4 file as metadata. exiftool can
dump all of it:
exiftool -ee ./GX030411.MP4 > telemetry.txt-ee (“extract embedded”) is the important flag: without it you only get the
file’s basic metadata, not the stream of GPS readings.
The gotcha that cost me a session: do this before joining clips. Long
recordings are split into several files, and concatenating them with ffmpeg
drops the embedded telemetry. Extract first, join later.
The same goes for sharing: messaging apps strip metadata. To pass raw videos to friends without losing the GPS, use a direct transfer tool like LocalSend or PairDrop.
Step 2: speed, laps and comparisons
From the text dump, Python parses timestamps, positions and speed into a dataframe. Then the useful questions become plots:
- Speed over time for a whole session.
- Each lap split out, with its fastest and slowest points.
- Two runs on the same stretch, to see where one driver brakes later or carries more speed through a corner.
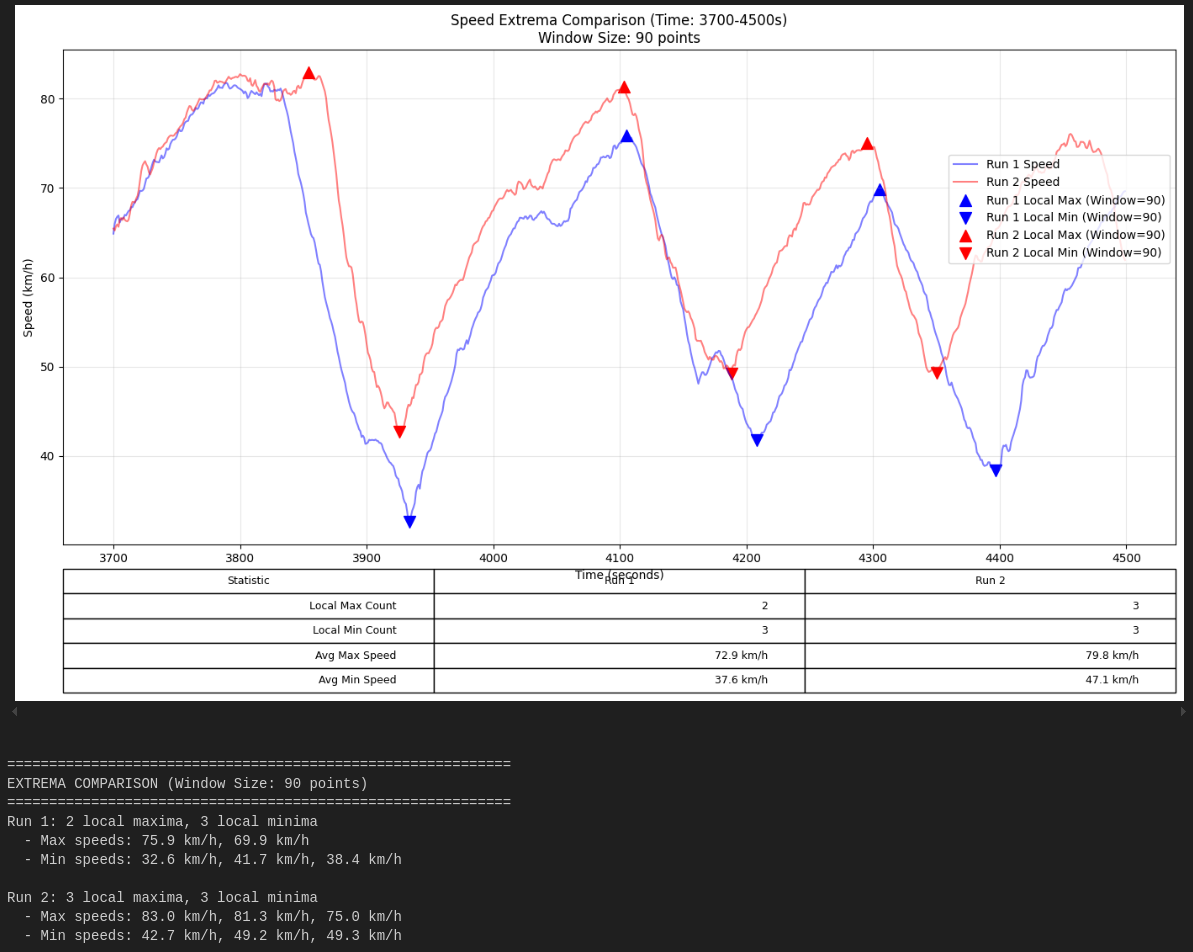
That comparison was the most useful output. On the same section, one run averaged 47 km/h at its slowest points against 38 km/h for the other. That’s the difference between braking and coasting into corners, and it’s visible in a chart in a way you never feel from the seat.
Step 3: put it on the video
A chart after the session is useful. A HUD on the video is what people actually watch. I tried two routes:
- My own Matplotlib HUD: render a small speed gauge and lap timer frame by
frame, then overlay it on the video with
ffmpeg. Full control over what’s shown, and a lot of iteration to make it look good. - gopro-dashboard-overlay: an open-source (GPL) Python project that turns the camera’s MP4 or GPX/FIT files into video dashboards and maps. It did in minutes much of what my script did.
My script ended up doing one job the tool didn’t: finding each person’s best lap in a group session and cutting those laps into a single video, so friends could compare their fastest laps one after another.
What I’d do differently now
- Start with the existing tool, and only write code for the part it doesn’t do (in my case, best-lap comparison across drivers).
- Log at a higher rate. Action-camera GPS is fine for speed and lap times, but corners happen fast. A dedicated GPS logger or a phone app with a higher sample rate gives much better braking points.
- Align laps by distance, not time. Comparing two drivers at “second 40” is misleading; comparing them at “metre 400” is fair.
- Keep the pipeline as one command: extract, parse, plot, render. Track days come in batches, and nobody wants to repeat six manual steps.
Takeaways
- Your camera may already be a data logger. Check before buying one.
- Extract telemetry before joining or sharing clips.
- Compare runs on the same stretch; that’s where the learning is.
- Use the open-source tool first, and code only the missing piece.