- Jan 12, 2025
- 3 min read
Shopify Analytics Insights
- Retail: A retail company can use DataNova to analyze sales data, identify best-selling products, and optimize inventory management. They can also forecast future sales based on historical trends and seasonal patterns.
graph TD
RL[Representation Layer: React + Recharts]
AL[Agentic Layer: FastAPI + Python Engine]
SL[Semantic Layer: BAML Definitions]
DL[Data Layer: PostgreSQL]

RL <--> AL
    AL <--> SL
        AL <--> DL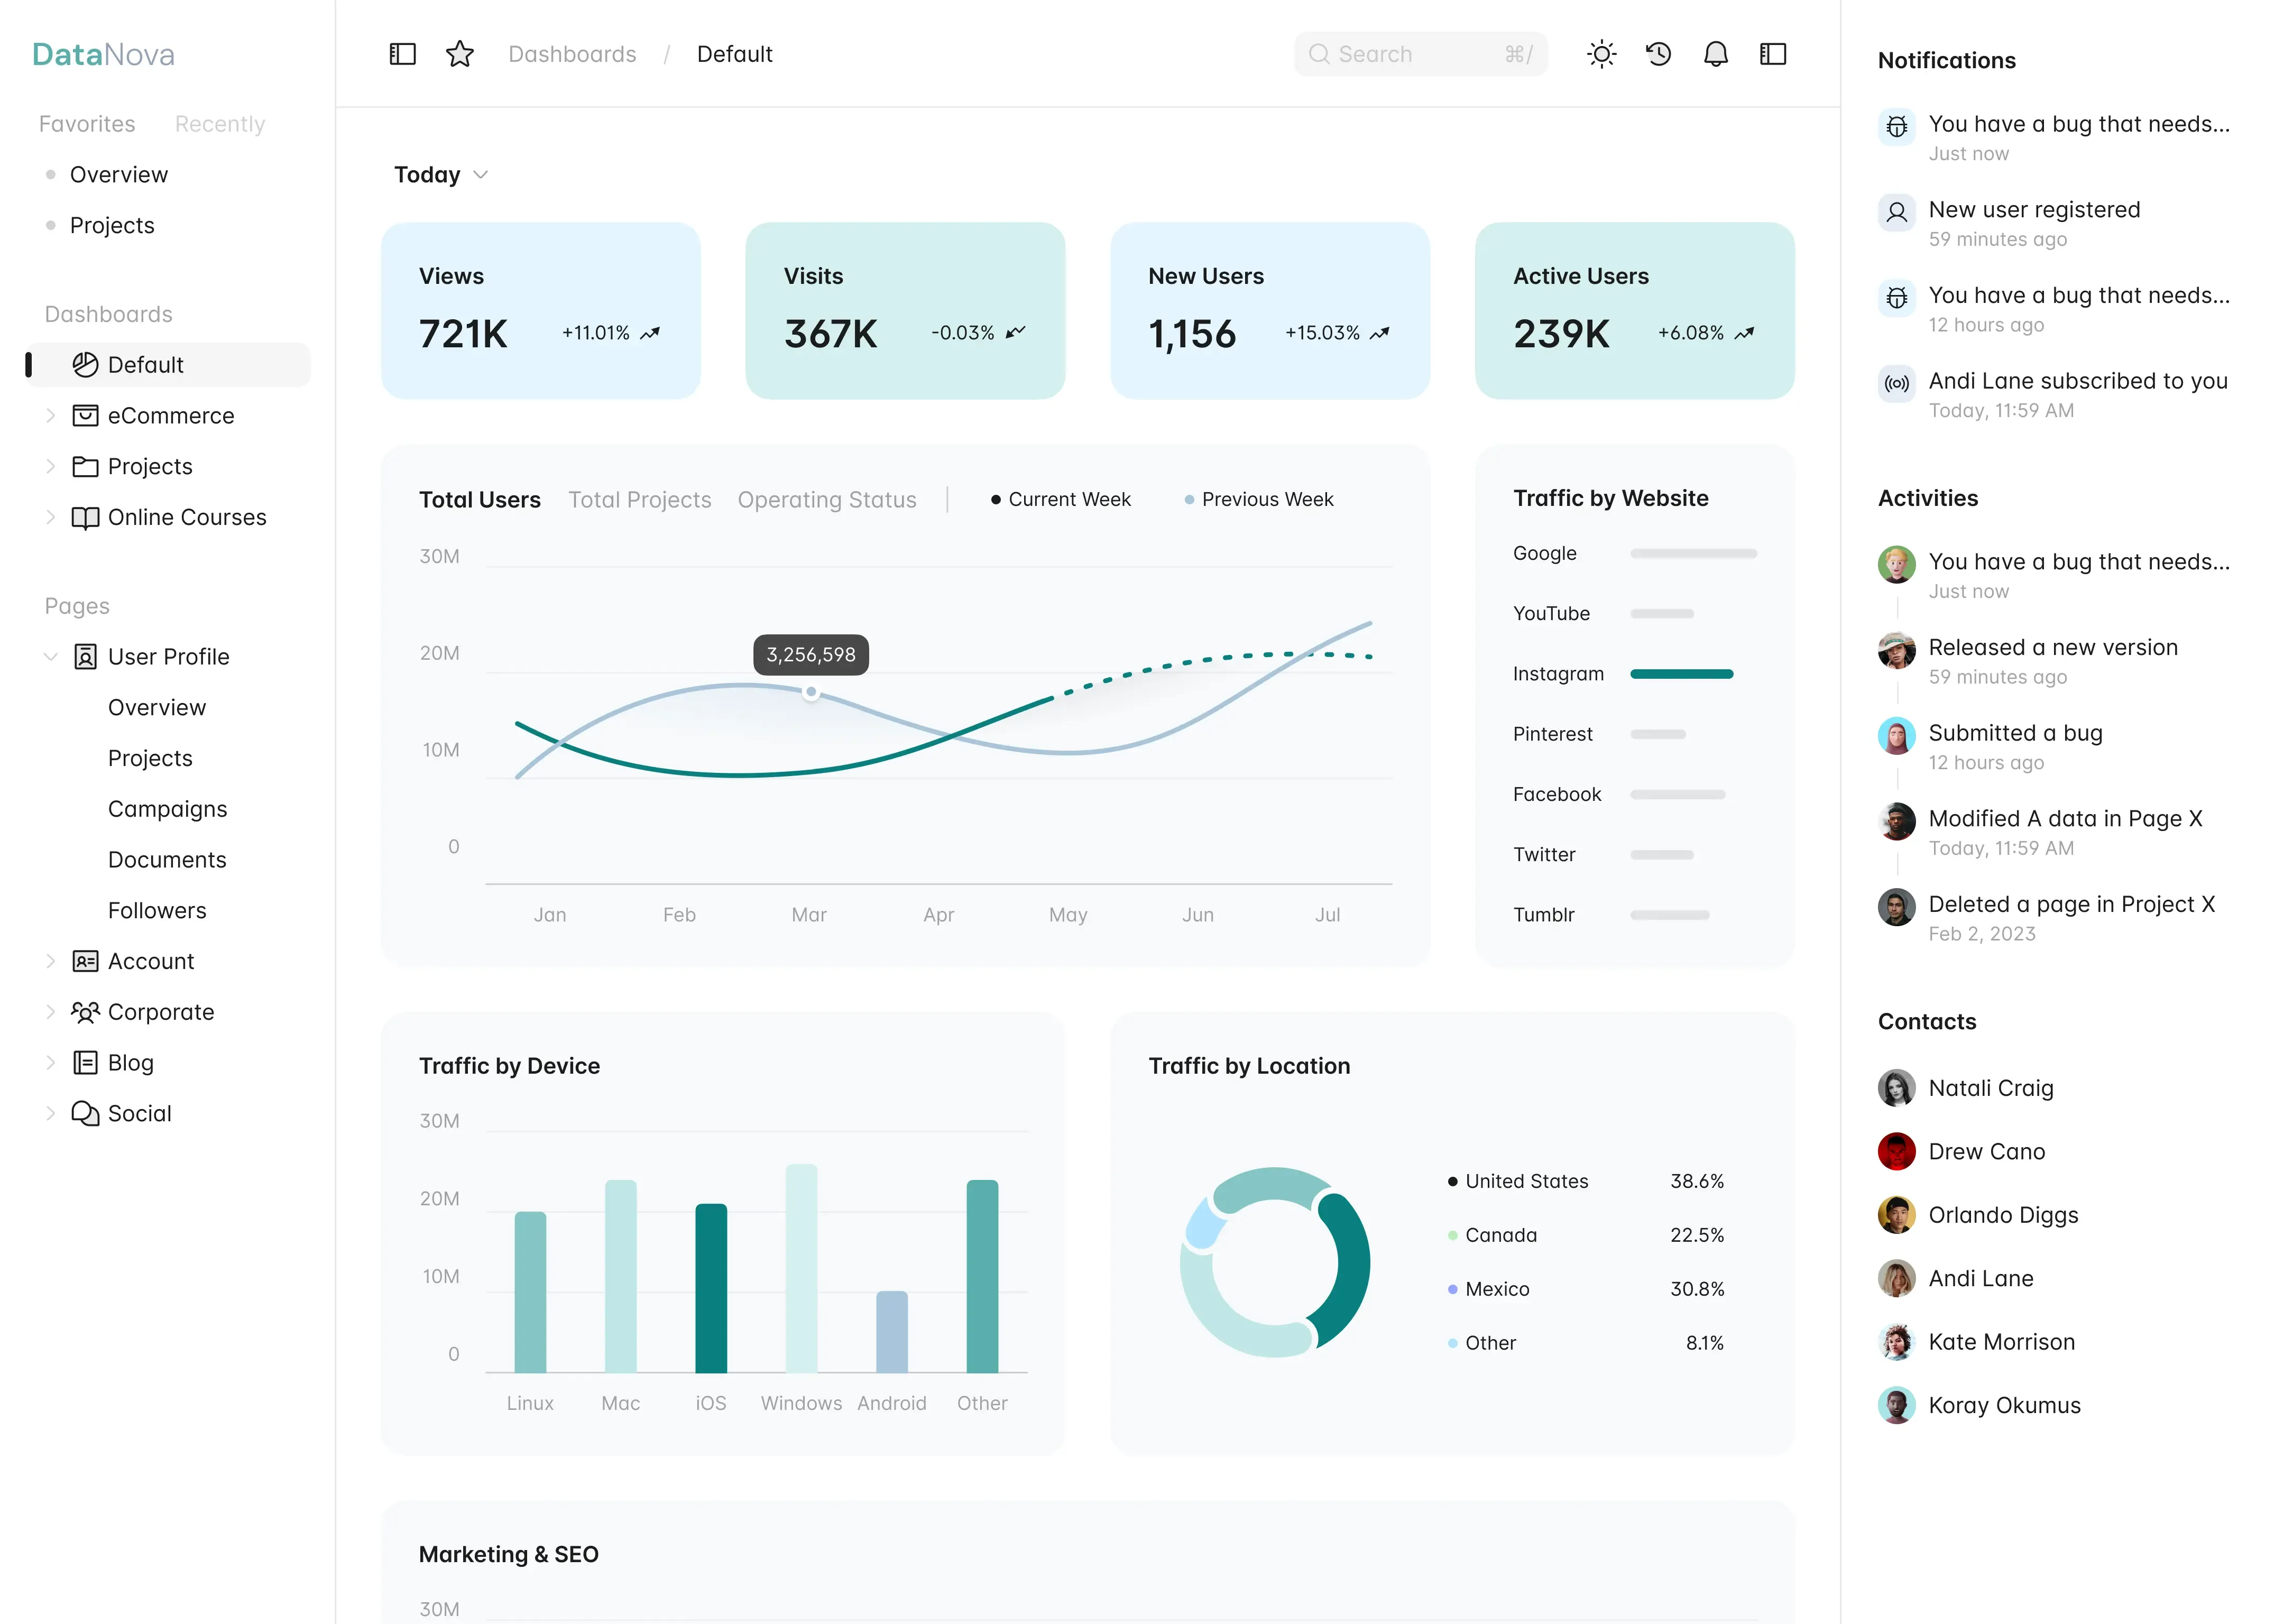
This is powered by the in house generative BI stack.
Why use dashboards?
Dashboards provide a consolidated view of your data, allowing you to visualize trends, track performance, and make data-driven decisions. Here are some key benefits of using dashboards:
- Real-Time Insights: Dashboards can be set up to refresh automatically, providing you with the most current data at any moment.
- Enhanced Decision-Making: By visualizing data, you can quickly identify patterns and anomalies, leading to more informed decisions.
- Improved Communication: Dashboards can be shared with stakeholders, making it easier to communicate insights and performance metrics.
- Customization: You can tailor dashboards to meet your specific needs, focusing on the metrics that matter most to your organization.
Conclusions
If you’ve ever worked around e-commerce teams, you know that its all aout conversions.
4. Real-time analytics
In today’s fast-paced business environment, real-time insights are crucial. DataNova provides real-time analytics capabilities, enabling organizations to monitor key metrics and make timely decisions. This feature is particularly beneficial for industries such as finance, retail, and healthcare, where timely information can significantly impact outcomes.
In today’s competitive business environment, leveraging financial data for strategic decision-making is crucial for success. DataNova provides a powerful platform that enables businesses to analyze financial data, optimize forecasts, and make smarter strategic decisions.
By leveraging DataNova’s capabilities, organizations can gain a deeper understanding of their financial performance, identify growth opportunities, and achieve their business objectives. Embracing data-driven decision-making through platforms like DataNova is no longer a choice, but a necessity for businesses looking to thrive in the modern world.
-
Data Integration: DataNova can integrate with various financial data sources, including accounting systems, CRM platforms, and market data providers. This allows you to consolidate all your financial data in one central location.
-
Data Visualization: Transform raw financial data into meaningful visualizations, such as charts, graphs, and dashboards. This makes it easier to identify trends, patterns, and outliers.
-
Key Performance Indicator (KPI) Tracking: Monitor key financial metrics and track progress towards business goals. Set up alerts to be notified of any significant deviations from targets.
-
Data Analytics: Leverage advanced analytics capabilities to uncover deeper insights from your financial data. Identify correlations, perform regression analysis, and discover hidden patterns.
DataNova’s smart analysis tools: a deep dive
DataNova’s suite of AI-powered tools is designed to empower businesses with intelligent insights:
- Automated Pattern Detection: DataNova’s AI algorithms can automatically identify complex patterns and relationships within your data, even those that might be invisible to the human eye. This can reveal valuable insights into customer behavior, market trends, and operational efficiency.
- Predictive Analytics: Leverage DataNova’s predictive modeling capabilities to forecast future outcomes based on historical data. Predict customer churn, anticipate market demand, and optimize resource allocation with greater accuracy.
- Anomaly Detection: Identify unusual or unexpected data points that could indicate potential problems or opportunities. Detect fraud, identify equipment malfunctions, or spot emerging trends before they become widespread.
- Sentiment Analysis: Analyze text data from social media, customer reviews, or surveys to understand customer sentiment and identify areas for improvement.
- Clustering and Segmentation: Automatically group similar data points together to create customer segments, identify market niches, or optimize product recommendations.
- Natural Language Processing (NLP): Utilize NLP to analyze unstructured data, such as text documents or emails, to extract key information and gain valuable insights.